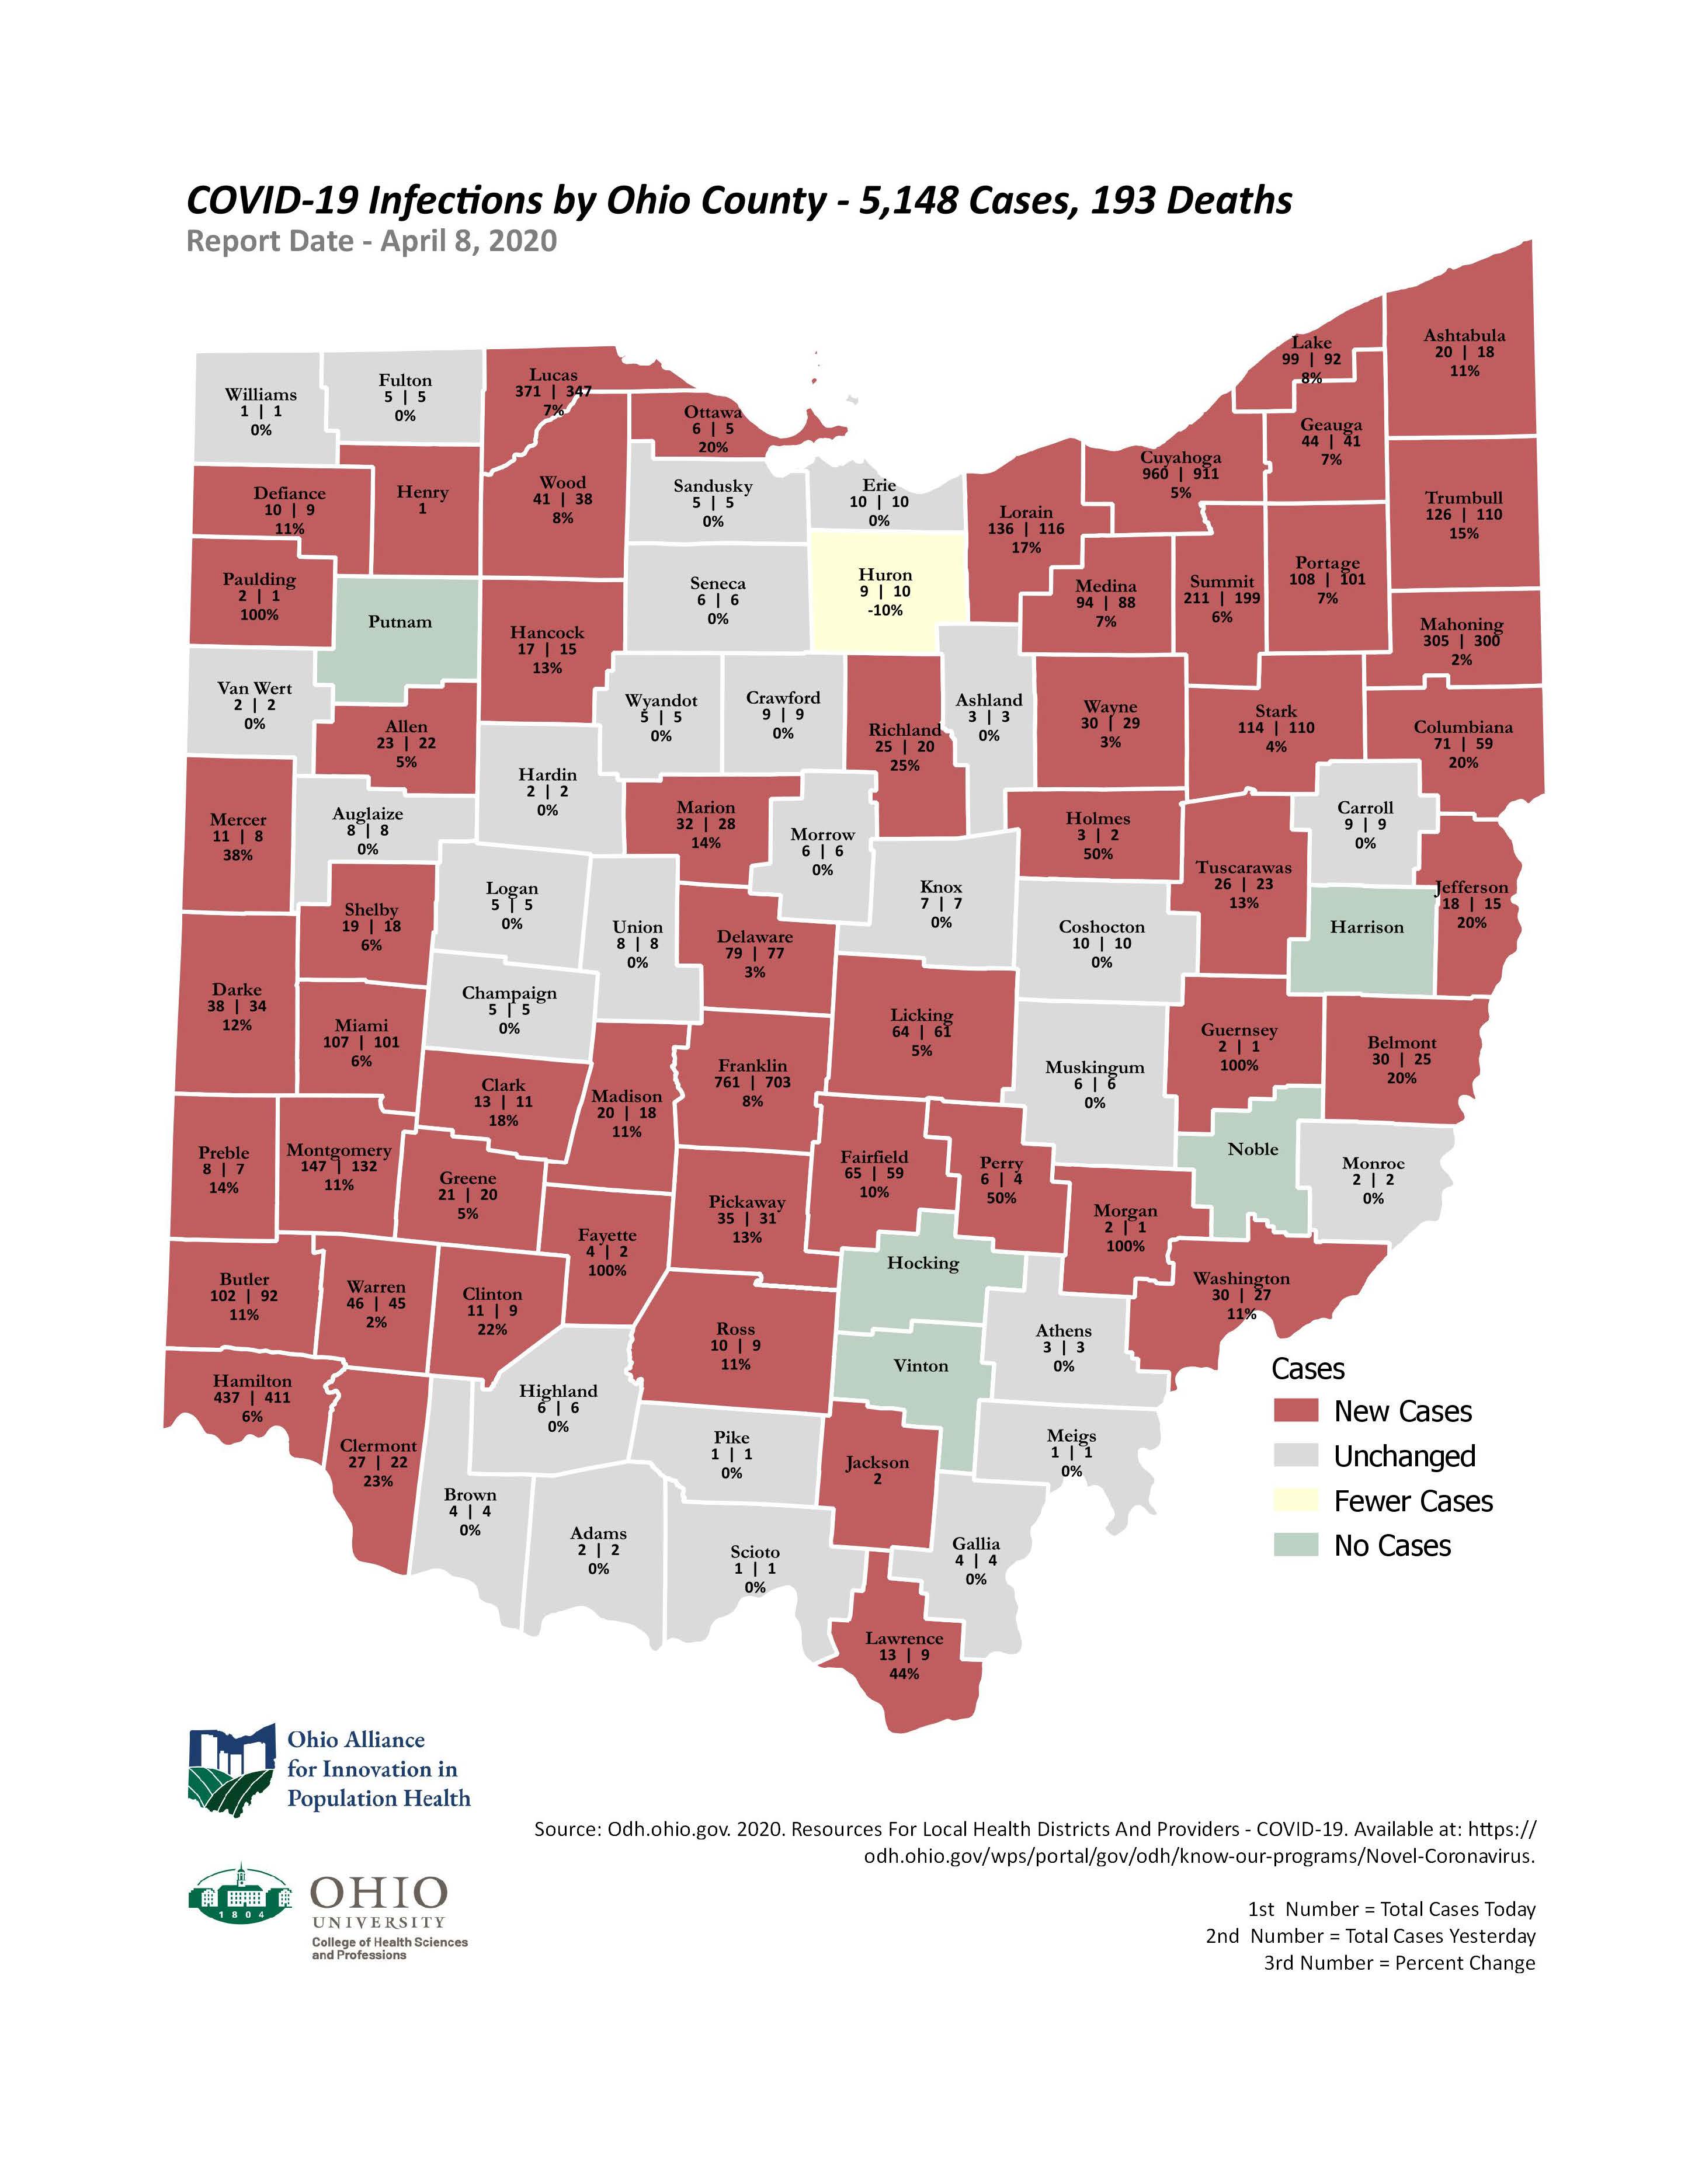
Social Distancing highly effective in reducing the spread of COVID-19 in Ohio
April 8, 2021
As of April 8, at 2pm, ODH tracking data shows a steady but attenuated rate of growth in COVID-19 infections throughout Ohio, a continuation of the trend noted in previous days and sustained evidence that social distancing has been highly effective in reducing the spread of the novel COVID pathogen.
Analysis of infections by region through yesterday (4/7/20), indicates tremendous variability by region with the Northeast accounting for almost half of all infections and the Southeast accounting for only 2.9%. Paradoxically, historic mortality data obtained by Ohio University from ODH and analyzed by Alliance and CHSP researchers suggests fatalities would be much higher in the Southeast region, given infection rates similar to other areas of the state.
COVID-19 Infections by Ohio Region
| Date in 2020 | Central | Northeast | Northwest | Southeast | Southwest | West | Total |
|---|---|---|---|---|---|---|---|
| 3/18 | 8 | 66 | 1 | 4 | 8 | 1 | 88 |
| 3/19 | - | 89 | 1 | 4 | 9 | 4 | 107 |
| 3/20 | 18 | 120 | 2 | 4 | 21 | 4 | 169 |
| 3/21 | 28 | 166 | 6 | 5 | 28 | 14 | 247 |
| 3/22 | 43 | 227 | 9 | 6 | 44 | 22 | 351 |
| 3/23 | 59 | 276 | 15 | 10 | 53 | 28 | 441 |
| 3/24 | 100 | 330 | 16 | 11 | 68 | 37 | 562 |
| 3/25 | 122 | 413 | 32 | 14 | 79 | 44 | 704 |
| 3/26 | 150 | 513 | 49 | 17 | 90 | 46 | 865 |
| 3/27 | 207 | 671 | 69 | 20 | 103 | 64 | 1,134 |
| 3/28 | 296 | 785 | 96 | 29 | 120 | 73 | 1,399 |
| 3/29 | 330 | 927 | 129 | 33 | 140 | 91 | 1,650 |
| 3/30 | 380 | 1,083 | 156 | 39 | 161 | 110 | 1,929 |
| 3/31 | 442 | 1,205 | 182 | 46 | 193 | 126 | 2,194 |
| 4/1 | 526 | 1,350 | 228 | 52 | 231 | 154 | 2,541 |
| 4/2 | 594 | 1,529 | 277 | 64 | 265 | 167 | 2,896 |
| 4/3 | 688 | 1,728 | 311 | 71 | 318 | 189 | 3,305 |
| 4/4 | 778 | 1,884 | 362 | 86 | 405 | 214 | 3,729 |
| 4/5 | 858 | 1,978 | 406 | 96 | 447 | 246 | 4,031 |
| 4/6 | 926 | 2,122 | 438 | 119 | 536 | 292 | 4,433 |
| 4/7 | 1,003 | 2,240 | 472 | 138 | 574 | 337 | 4,764 |
COVID-19 Infections by Ohio Region by Percentages
| Date in 2020 | Central | Northeast | Northwest | Southeast | Southwest | West | Total |
|---|---|---|---|---|---|---|---|
| 3/18 | 9.1% | 75.0% | 1.1% | 4.5% | 9.1% | 1.1% | 100.0% |
| 3/19 | 0.0% | 83.2% | 0.9% | 3.7% | 8.4% | 3.7% | 100.0% |
| 3/20 | 10.7% | 71.0% | 1.2% | 2.4% | 12.4% | 2.4% | 100.0% |
| 3/21 | 11.3% | 67.2% | 2.4% | 2.0% | 11.3% | 5.7% | 100.0% |
| 3/22 | 12.3% | 64.7% | 2.6% | 1.7% | 12.5% | 6.3% | 100.0% |
| 3/23 | 13.4% | 62.6% | 3.4% | 2.3% | 12.0% | 6.3% | 100.0% |
| 3/24 | 17.85 | 58.7% | 2.8% | 2.0% | 12.1% | 6.6% | 100.0% |
| 3/25 | 17.3% | 58.7% | 4.5% | 2.0% | 11.2% | 6.3% | 100.0% |
| 3/26 | 17.3% | 59.3% | 5.7% | 2.0% | 10.4% | 5.3% | 100.0% |
| 3/27 | 18.3% | 59.2% | 6.1% | 1.8% | 9.1% | 5.6% | 100.0% |
| 3/28 | 21.2% | 56.1% | 6.9% | 2.1% | 8.6% | 5.2% | 100.0% |
| 3/29 | 20.0% | 56.2% | 7.8% | 2.0% | 8.5% | 5.5% | 100.0% |
| 3/30 | 19.7% | 56.1% | 8.1% | 2.0% | 8.3% | 5.7% | 100.0% |
| 3/31 | 20.1% | 54.9% | 8.3% | 2.1% | 8.8% | 5.7% | 100.0% |
| 4/1 | 20.7% | 53.1% | 9.0% | 2.0% | 9.1% | 6.1% | 100.0% |
| 4/2 | 20.5% | 52.8% | 9.6% | 2.2% | 9.2% | 5.8% | 100.0% |
| 4/3 | 20.8% | 52.3% | 9.4% | 2.1% | 9.6% | 5.7% | 100.0% |
| 4/4 | 20.9% | 50.5% | 9.7% | 2.3% | 10.9% | 5.7% | 100.0% |
| 4/5 | 21.35 | 49.1% | 10.1% | 2.4% | 11.1% | 6.1% | 100.0% |
| 4/6 | 20.9% | 47.9% | 9.9% | 2.7% | 12.1% | 6.6% | 100.0% |
| 4/7 | 21.1% | 47.0% | 9.9% | 2.9% | 12.0% | 7.1% | 100.0% |