Search within:
A family reads and works on a laptop outdoors
Evaluation and Analytics
How We're Impacting Ohio's Business and Organizations

Evaluation and Analytics

Expanding Data Access and Use

The Voinovich School leverages data to help communities, government agencies, nonprofits, and businesses make sense of a changing world, evaluate the impacts of programs and policies, and build articulate data-rich communication narratives geared toward stakeholders.

Our analytics team members have decades of experience with primary and secondary quantitative and qualitative data collection (including, but not limited to surveys, focus groups and interviews), statistical analyses, program evaluations, needs assessments, impact analyses (both economic and social), GIS mapping, and data visualizations.

While our qualitative analysis software toolkit includes MAXQDA, NVivo, and ATLAS.ti, on the quantitative side we are experienced in R, Python, Stata, and SPSS programs. Tableau, R and the complete suite of Adobe Creative Cloud applications drive our data visualization work.

Our Programs at Work in the Community

Health worker holding a woman's hands

Department of Youth Services PREP Evaluation


The U.S. Department of Health and Human Services provides funding for state-level personal responsibility education programs to reduce pregnancy and sexually transmitted infections (including HIV/AIDS) among youth in the child welfare and juvenile justice systems. The Ohio Department of Health (ODH) is administering the PREP throughout the state in nine regions via agencies at the local level, and the Voinovich School is leading an evaluation of this statewide initiative.

Youth Services PREP Evaluation

Kids on Campus staff oversee Tech Savvy activities

Kids on Campus Evaluation


Kids on Campus is a rural community-university partnership that empowers underserved, at-risk children and their families in the realization of their full potential through educational, nutritional and recreational opportunities. The Voinovich School serves as a long-term partner, conducting periodic evaluations of the program's impact and exploring ways to further enhance its effectiveness. 

Kids on Campus

Liam Speakman with data visualization

Appalachia Ohio Regional Data Hub


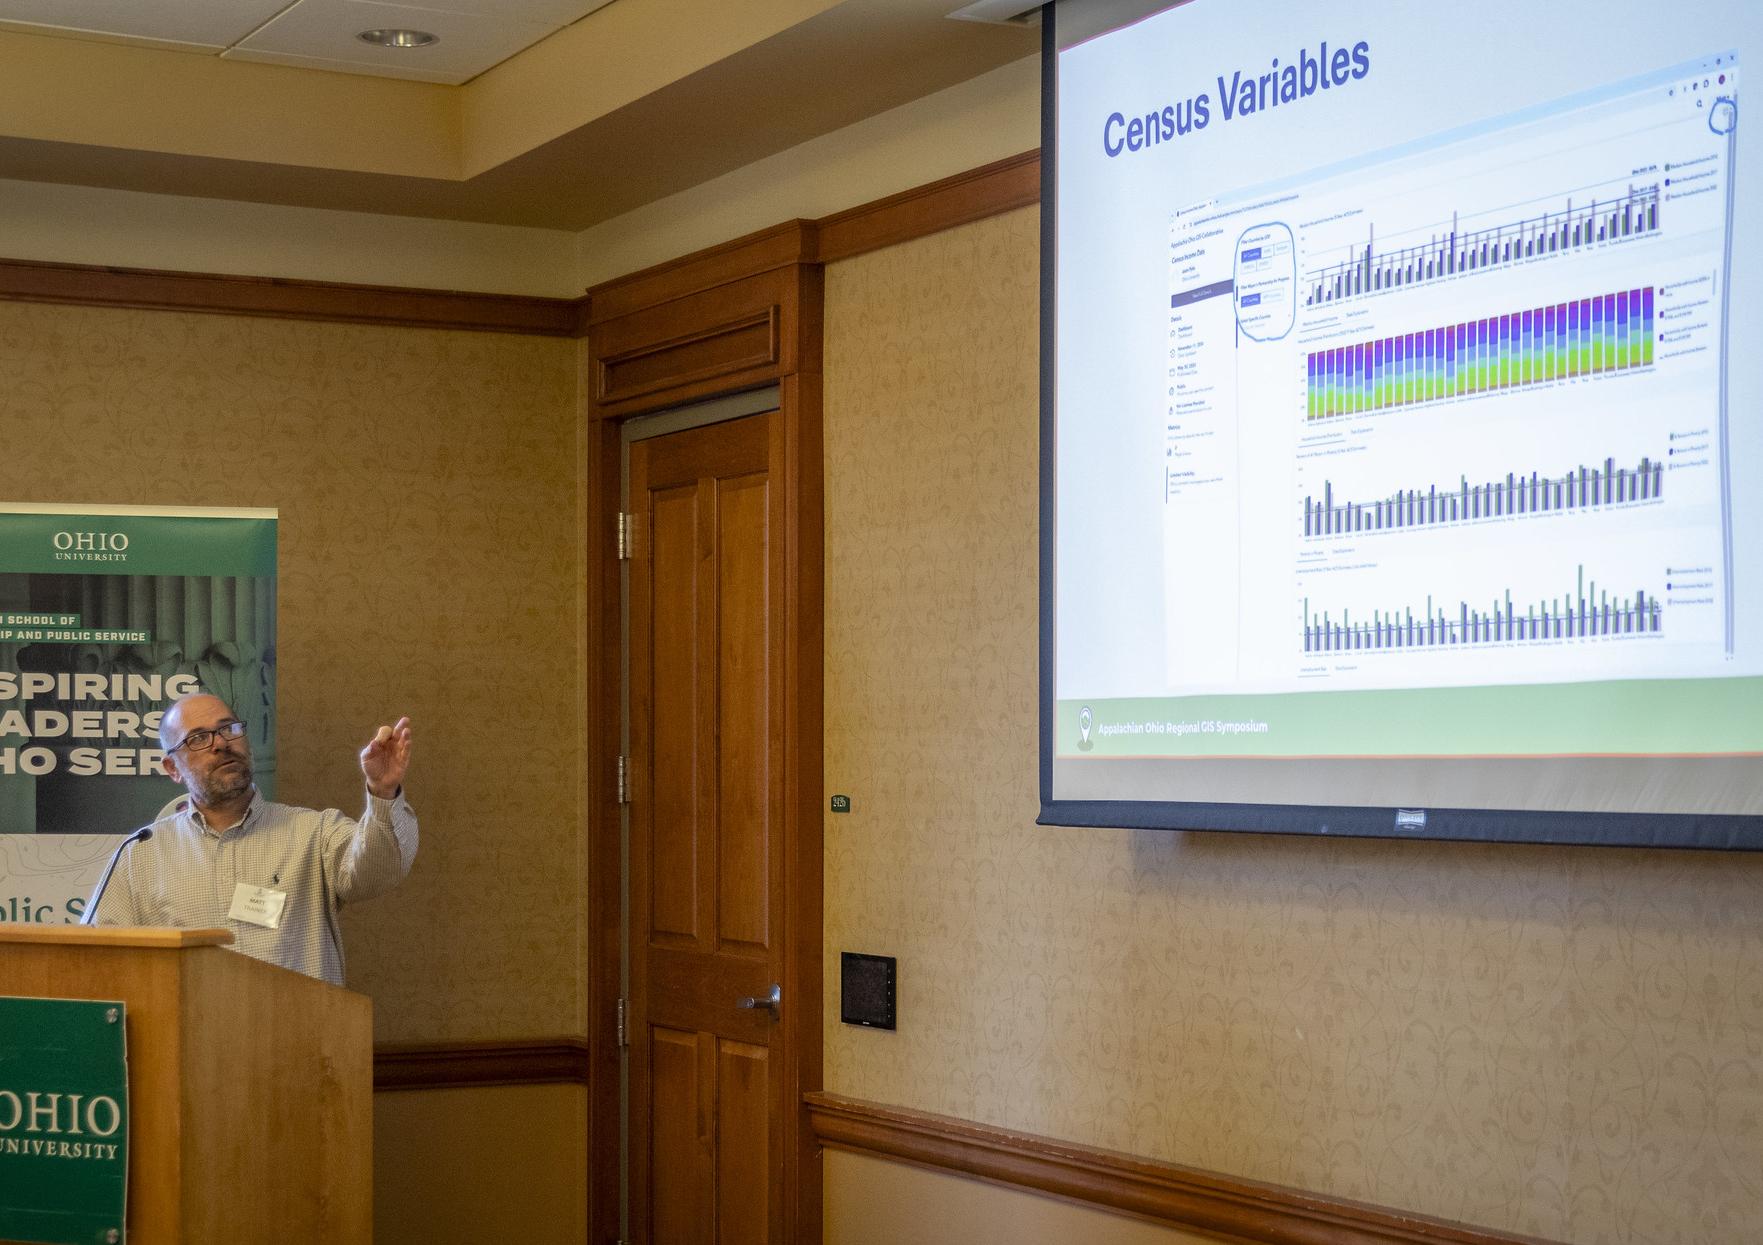
This collaborative effort among local development districts, the Mayors’ Partnership for Progress, and the Voinovich School seeks to provide quicker, more accessible regional data from sources such as the Census Bureau, EPA, Ohio Department of Education, Ohio Department of Transportation, Federal Reserve, and HUD. It includes GIS maps, datasets, visualization tools and community profiles covering topics such as demographics, housing, infrastructure, health and the economy. 

A health student at Ohio University's Eastern Campus

Ohio Medicaid Assessment Survey


For over a decade, Voinovich School faculty and staff have worked as core members of OMAS teams, documenting health-care behaviors, chronic health conditions, access to care, and unmet needs of Ohio’s adults and children, with a special focus on differences in these domains between rural Appalachia and the rest of the state. Many chartbooks based on the 2023 OMAS will soon be released to the public, even as the 2025 OMAS is beginning to take shape. 

Ohio Medicaid Assessment Survey

How We Can Help You

Discover the Services We Provide and Meet Our Team Members

  • Assessment, Planning and Evaluation


    For more than 20 years, we have been assisting government agencies and nonprofits to understand their current environment and prepare for the future. Our services include program evaluation, needs assessment, strategic planning, technical assistance, and data analysis.

    Team Leads: Margaret Hutzel and Jacob White

  • Impact Measurement and Management


    We partner with organizations to measure and communicate impact through tools such as social return on investment. SROI is a methodology that accounts for the social, environmental and economic impacts of activities and translates these impacts into expressions of monetary value.

    Team Leads: Allison Ricket and Kelli Schoen

  • GIS and Data Visualization


    We are a full-service mapping consulting service dedicated to providing innovative GIS solutions. Our experienced team utilizes the latest technologies to deliver high-quality, data-driven custom software solutions and data visualization for improved decision-making, with a focus on land use, green-way analysis, watersheds, energy supply chain and business.

    Team Lead: Elkan Kim

  • Data Analytics


    We work very closely and collaboratively with federal, state and local partners to gather, analyze and communicate insights from both quantitative (surveys, Census and other secondary data sources, administrative data records, etc.) and qualitative (interviews, focus groups, open-ended survey responses, etc.). Our analysts and other project-related professionals are well-trained and technically equipped to handle HIPAA, FERPA, and more customized covenants related to sensitive data.

    Team Lead: Ani Ruhil

Applied Learning

As part of our educational mission, the Voinovich School engages students and Voinovich Undergraduate Research Scholars to work closely with faculty and staff on these projects. 

Experiences vary, but opportunities include conducting and analyzing surveys, focus groups, and interviews; contributing to curriculum development and implementation; assisting with community meeting facilitation; and developing public reports, presentations and infographics.